We do our best to make Testent fly big time. To make that happen we started to collect data to understand how are we doing. The next question was “What kind of startup metrics to track on a dashboard?”. In this blog post I’ll show what kind of data we collect. I’ll also show what kind of metrics we track on our dashboard.
We have data coming in currently from Microsoft Marketplace and Google Analytics. Our Testent VSCode extension is on the Microsoft Marketplace and from there we get downloads and page views of our Marketplace page. From Google Analytics we get the basic website user data for this site Testent.io
Microsoft Marketplace data
From the Marketplace we get the following kind of dashboard. And with a quick internet search it seems there is no API to get this data. The Marketplace has an API for the commercial side but the VSCode Extension Marketplace does not seem to be part of that. This means we need to fetch this data manually to get up-to-date insights.

From the “Export” button we can download the following kind of spread sheet.
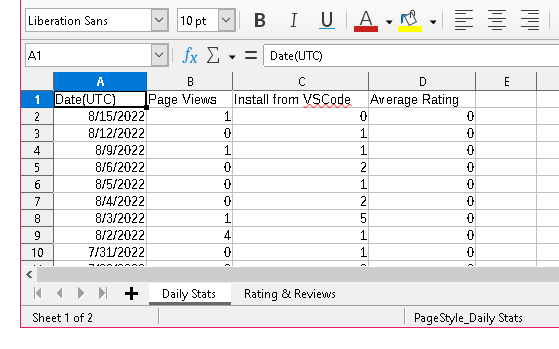

Google Sheets to collect and process
We use Google Sheets to store and process the spread sheet data from the Microsoft Marketplace. You may have noticed that the Date column is missing some dates 😱
Luckily found a formula to add the missing dates from Stackexchange. The following monster of a formula adds the missing dates. I have no idea how it works 😁 But I was able to modified it a bit with trial and error to expand to all the columns I needed.
=ARRAYFORMULA({TO_DATE(ROW(INDIRECT("A"&DATEVALUE(MIN(A:A))&":B"&DATEVALUE(MAX(A:A))))), IFERROR(VLOOKUP(TO_DATE(ROW(
INDIRECT("A"&DATEVALUE(MIN(A:A))&":B"&DATEVALUE(MAX(A:A))))), A:B, 2, 0)), IFERROR(VLOOKUP(TO_DATE(ROW(
INDIRECT("A"&DATEVALUE(MIN(A:A))&":C"&DATEVALUE(MAX(A:A))))), A:C, 3, 0)),IFERROR(VLOOKUP(TO_DATE(ROW(
INDIRECT("A"&DATEVALUE(MIN(A:A))&":D"&DATEVALUE(MAX(A:A))))), A:D, 4, 0))
})
Here is the spread sheet we keep updating. You can use this as a template for your spread sheet.
Google Datastudio visualize the data
We use Google Datastudio to visualize the data from Google Analytics and from the Google sheet containing the processed Marketplace data. Datastudio turned out to be pretty easy to use when I started from a ready template. I didn’t get a graph working which had time series data both from Google Sheets and Google Analytics in the same graph. The numbers didn’t match up in the graph.
Our public metrics dashboard
Here you can see the public metrics we share with all of you. We want to show #buildinpublic community what we are doing and how did we do it. We hope people like us can learn something from us when we share our stories.
The graphs are from Google Datastudio where we made each graph as it’s own little report. The reports can then be shared and embedded to any site in an iframe.
You can read also my little trick to make the iframe responsive.

Our internal dashboard
At the time of writing this post we track the following start up metrics. The below screenshot is our Google Datastudio report for KPIs we track.

Conclusion
Making a startup dashboard with metrics turned out to be easier than I expected. The dashboard metrics are now based on half manually downloaded spread sheet and half fully automated Google Analytics data.
This is a good start for startup metrics to track on a dashboard. These let us understand what drives the installs of our product and user visits.
Next metrics to add are most likely metrics based on Twitter data from Twitter analytics. I’ll write a new post when we add that data showing how we do it.